The most basic definition of communication is that it is the process of passing information and understanding from one person to another. While this sounds simple enough, a pre-requisite for successful communication is that both persons involved speak a common language. Imagine a teacher trying to teach students in a language they do not comprehend. Or a salesman trying to explain the features of his product to someone who neither speaks nor understands the language he is speaking in. These interactions would likely be futile or – at the very least – not entirely satisfactory or productive for either party involved.
What’s the point of my little anecdotes about communication and a common language? Simply that we in the marketing analytics business need to recognize and acknowledge a problematic communication situation we face regularly in our business and start thinking of solutions.
I’m referring to our interactions with brand managers and senior executives at client organizations to whom we routinely present marketing insights and recommendations based on analytics. And the problem I see is this – More often than not, analytics practitioners and brand people don’t speak the same language, figuratively.
Analytics practitioners are typically ‘left-brain’ people who swear by facts, numbers and logic and think in a linear fashion. However, brand managers and senior executives at large consumer goods companies and similar client organizations are often ‘right-brain’ people. 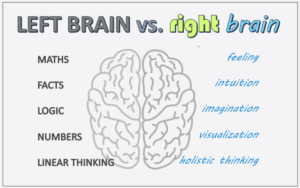 They often operate on intuition and feeling and look at pure rationality and complex analysis with some distrust when it comes to understanding consumer behavior and brand management. “You’ve got to feel the brand” is something you will often hear them say. I’m of course not using left-brain and right-brain in the strict neuro-science sense of the terms, but rather in the way they are commonly understood as different cognitive styles.
Let’s look at a simple consumer buying-behavior moment and how analytics and brand people might process it differently. A woman shopper is standing in front of the beverages shelf in the supermarket to pick up a carton of beverages for her family for the week. She looks at all the choices. From a health perspective she is considering buying water rather than a sugary drink. She then thinks about what will delight her kids and is tempted to pick up the sugary drink. She also remembers her household budget constraints that month and is inclined to choose the store’s cheaper private label brand over the more expensive big brands. And then, after weighing all these competing pulls, she makes her choice.
Marketing analytics does incorporate these different competing factors in the purchase decision process, but in hard numerical terms e.g. a percentage weight or probability for each factor. But the brand manager seeks to more completely visualize and “feel” the whole situation to really understand the various pulls and pressures that influence the shopper’s purchase decision process.
This same inclination and fondness for (only) data and analytical reasoning is reflected when marketing analytics firms present our findings to clients. We show them dozens of data-heavy tables, charts and graphs that explain their sales and business 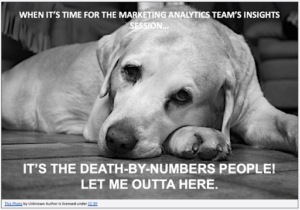 performance and then recommend marketing strategies and programs they should employ to maximize their marketing Return on Investment. But we don’t consider certain important aspects of their cognitive make-up and the language they speak and understand. And so, most of what we present is lost in translation.
The nature of brand managers and senior executives to rely not just on numbers and analysis but also often on intuition can, and must, be addressed when designing our tools and communications. It may not be productive to try and force a purely analytical thought process on people who believe that numbers, rationality and logic alone cannot always grasp the complexity of businesses, brands and human behavior. While they may not openly disagree with what we present, they will simply not be fully “convinced” and will just disengage with whatever is being presented.
What’s needed are new ways to present our findings and tailor our communications to their cognitive styles and to today’s media habits. Data must be presented not as charts and graphs but must be woven into stories and narratives that provide context and build the data’s relevance. Engaging infographics and short videos are much more effective and easier to absorb than long, number-heavy presentations. Provocative statements or tweets that spark discussion, “top 10” lists that nudge people to click and read on and satisfying memes that drive home a point with a touch of irreverence are successful staples in today’s social media landscape. We must employ these and other proven communication tactics to engage our audience and get them to buy-in to our insights and recommendations.
Author: Sebastien Jeanneret, Analytic Edge
